


American drivers are finally seeing relief at the pump as gasoline prices have fallen more than 20 percent since reaching their peak in April. The decline comes amid easing geopolitical tensions and the announcement of a potential deal to end hostilities in key oil-producing regions. Market analysts now suggest that prices could continue to slide further if current technical patterns play out as expected.
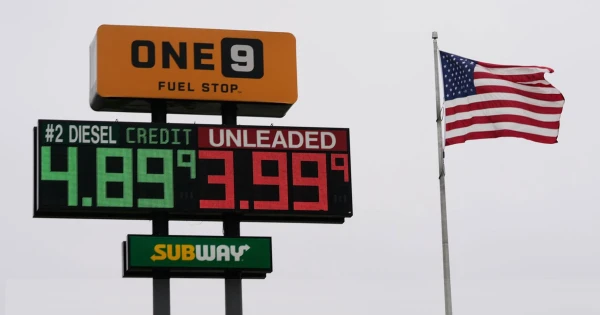
The significant drop in fuel costs represents a welcome change for consumers who have been grappling with high energy prices for months. Since the Iran-war peak in April, when gasoline futures reached approximately $3.82 per gallon, prices have steadily declined to current levels around $3.20 to $3.25. This downward trend has provided much-needed relief for households and businesses alike.
Technical analysts have identified a classic head-and-shoulders pattern forming on gasoline futures charts since the conflict began. This particular formation is widely regarded as one of the most reliable indicators that a market may be reversing its previous upward trajectory. The pattern resembles a silhouette with three distinct peaks, where two smaller shoulders flank a taller central head.

The left shoulder of this pattern formed around March 23 near the $3.40 level. The head reached its peak on April 30 at approximately $3.82, marking the highest point during the conflict-driven surge. Currently, the right shoulder is taking shape in the $3.20 to $3.25 range, suggesting the pattern remains active and could signal further price declines ahead.
The neckline, which connects the two shoulders, sits near the $2.90 level. When prices fall below this threshold, it typically confirms the pattern and indicates more losses are likely. If the head-and-shoulders pattern plays out fully, analysts project a measured move lower of approximately $0.90 from the breakdown point, potentially dragging prices down to the $2.00 to $2.10 range where they traded before the conflict began.
The Relative Strength Index, a momentum indicator that measures the speed and change of price movements, is also pointing lower. However, the indicator is approaching oversold territory, suggesting that the right shoulder may require additional time to fully develop. Notably, the RSI failed to confirm the April peak, creating a divergence that traders interpret as a warning sign that the previous rally was losing momentum.
Gasoline prices have remained highly sensitive to developments in the Iran conflict and may continue to respond to geopolitical news until any deal is fully sealed and subsequent negotiations take place. The market's reaction to diplomatic progress has been particularly pronounced, with prices dropping sharply following announcements of potential peace agreements.
For prices to signal a return to higher levels, gasoline futures would need to climb back above the $3.40 mark. Such a move would negate the current head-and-shoulders pattern and suggest that bullish forces are reasserting control over the market. Until then, the technical outlook points toward continued downward pressure on fuel costs.
The current market dynamics reflect the complex interplay between geopolitical events and technical trading patterns. While the head-and-shoulders formation provides a framework for understanding potential price movements, actual market behavior will depend on numerous factors including supply and demand fundamentals, production decisions by major oil-producing nations, and broader economic conditions.
Consumers and businesses should remain aware that while the current trend suggests further price declines, energy markets remain inherently volatile. The completion of any peace deal and subsequent negotiations will likely continue to influence price movements in the coming weeks and months.
The recent price action demonstrates how technical analysis can provide valuable insights into market direction when combined with an understanding of underlying fundamental factors. As the situation continues to evolve, market participants will be watching closely to see whether the projected move toward the $2.00 to $2.10 range materializes or if new developments alter the current trajectory.
For now, American drivers can take some comfort in the declining prices at the pump, with the possibility of even more significant savings ahead if technical projections prove accurate. The coming weeks will be crucial in determining whether the current pattern completes its full measured move or if geopolitical developments intervene to change the market's direction.